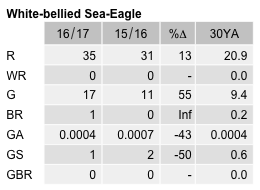
White-bellied Sea-Eagle
Haliaeetus leucogaster
ABR description
The following is extracted from the Annual Bird Report for the twelve months to June 2017.
Uncommon, non-breeding visitor
Occasionally seen over our area’s lakes and rivers, or travelling between them.
General: 35 records, but a reporting rate of 0.2% against the long-term average of 0.8%. Mostly single birds, recorded from 17 widespread mainly rural grid cells. Recorded throughout the year, though with fewer summer records (17%). One rural breeding possibility of birds canvassing a possible nest site, 2 Oct Bloomfield Flats D06 (SeB1).
GBS: One record only, 1/ 9 Oct Curtin (AjR1). Self-evidently the sea-eagle is not a garden bird but a few manage to overfly suburbia from time to time.
Abundance
Abundance is the average number of birds of that species per survey. Where the species was observed (presence recorded) but the number of birds seen was not recorded, this is treated as a count of zero.
Abundance by year
This chart shows the abundance of White-bellied Sea-Eagle between 1982 and 2017. 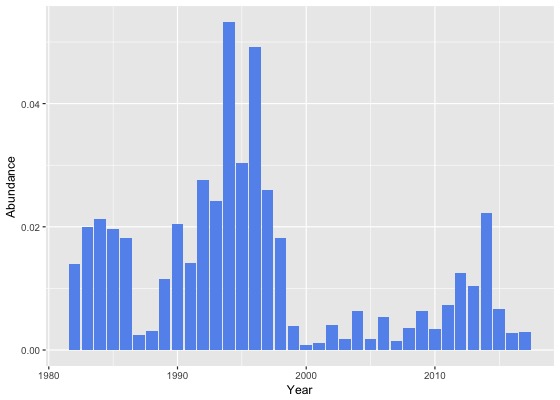
Abundance by month
This chart shows the monthly abundance of White-bellied Sea-Eagle. The blue lines show the abundance for the twelve months to June 2017 and the bars show the average abundance for the period 1982 to 2017. 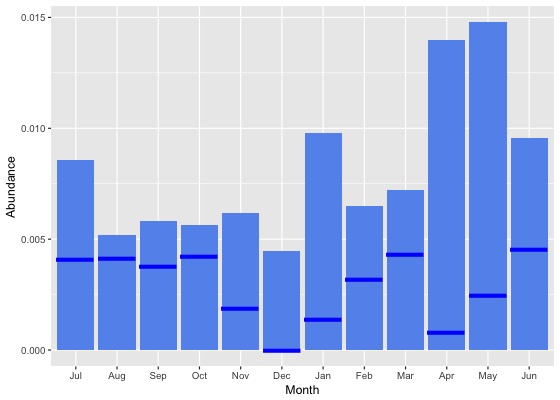
Abundance by season
This chart shows the seasonal abundance of White-bellied Sea-Eagle. The blue lines show the seasonal abundance for the twelve months to June 2017 and the bars show the average seasonal abundance for the period 1982 to 2017. 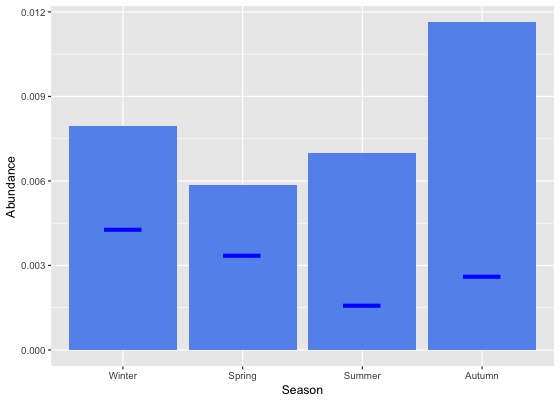
Abundance data
| Month | Season | ||||||||||||||||||
|---|---|---|---|---|---|---|---|---|---|---|---|---|---|---|---|---|---|---|---|
| Period | Jul | Aug | Sep | Oct | Nov | Dec | Jan | Feb | Mar | Apr | May | Jun | Winter | Spring | Summer | Autumn | All | ||
| All years | |||||||||||||||||||
| All | 0.0 | 0.0 | 0.0 | 0.0 | 0.0 | 0.0 | 0.0 | 0.0 | 0.0 | 0.0 | 0.0 | 0.0 | 0.0 | 0.0 | 0.0 | 0.0 | 0.0 | ||
| Previous years | |||||||||||||||||||
| All previous years | 0.0 | 0.0 | 0.0 | 0.0 | 0.0 | 0.0 | 0.0 | 0.0 | 0.0 | 0.0 | 0.0 | 0.0 | 0.0 | 0.0 | 0.0 | 0.0 | 0.0 | ||
| Previous 30 years | 0.0 | 0.0 | 0.0 | 0.0 | 0.0 | 0.0 | 0.0 | 0.0 | 0.0 | 0.0 | 0.0 | 0.0 | 0.0 | 0.0 | 0.0 | 0.0 | 0.0 | ||
| Previous 20 years | 0.0 | 0.0 | 0.0 | 0.0 | 0.0 | 0.0 | 0.0 | 0.0 | 0.0 | 0.0 | 0.0 | 0.0 | 0.0 | 0.0 | 0.0 | 0.0 | 0.0 | ||
| 10 year groups | |||||||||||||||||||
| [2007,2017) | 0.0 | 0.0 | 0.0 | 0.0 | 0.0 | 0.0 | 0.0 | 0.0 | 0.0 | 0.0 | 0.0 | 0.0 | 0.0 | 0.0 | 0.0 | 0.0 | 0.0 | ||
| [1997,2007) | 0.0 | 0.0 | 0.0 | 0.0 | 0.0 | 0.0 | 0.0 | 0.0 | 0.0 | 0.0 | 0.0 | 0.0 | 0.0 | 0.0 | 0.0 | 0.0 | 0.0 | ||
| [1987,1997) | 0.0 | 0.0 | 0.0 | 0.0 | 0.0 | 0.0 | 0.0 | 0.0 | 0.0 | 0.0 | 0.0 | 0.0 | 0.0 | 0.0 | 0.0 | 0.0 | 0.0 | ||
| 5 year groups | |||||||||||||||||||
| [2012,2017) | 0.0 | 0.0 | 0.0 | 0.0 | 0.0 | 0.0 | 0.0 | 0.0 | 0.0 | 0.0 | 0.0 | 0.0 | 0.0 | 0.0 | 0.0 | 0.0 | 0.0 | ||
| [2007,2012) | 0.0 | 0.0 | 0.0 | 0.0 | 0.0 | 0.0 | 0.0 | 0.0 | 0.0 | 0.0 | 0.0 | 0.0 | 0.0 | 0.0 | 0.0 | 0.0 | 0.0 | ||
| [2002,2007) | 0.0 | 0.0 | 0.0 | 0.0 | 0.0 | 0.0 | 0.0 | 0.0 | 0.0 | 0.0 | 0.0 | 0.0 | 0.0 | 0.0 | 0.0 | 0.0 | 0.0 | ||
| [1997,2002) | 0.0 | 0.0 | 0.0 | 0.0 | 0.0 | 0.0 | 0.0 | 0.0 | 0.0 | 0.0 | 0.0 | 0.0 | 0.0 | 0.0 | 0.0 | 0.0 | 0.0 | ||
| [1992,1997) | 0.1 | 0.0 | 0.0 | 0.0 | 0.0 | 0.0 | 0.0 | 0.0 | 0.0 | 0.1 | 0.0 | 0.1 | 0.0 | 0.0 | 0.0 | 0.0 | 0.0 | ||
| [1987,1992) | 0.0 | 0.0 | 0.0 | 0.0 | 0.0 | 0.0 | 0.0 | 0.0 | 0.0 | 0.0 | 0.0 | 0.0 | 0.0 | 0.0 | 0.0 | 0.0 | 0.0 | ||
| Year | |||||||||||||||||||
| 2017 | 0.0 | 0.0 | 0.0 | 0.0 | 0.0 | 0.0 | 0.0 | 0.0 | 0.0 | 0.0 | 0.0 | 0.0 | 0.0 | 0.0 | 0.0 | 0.0 | 0.0 | ||
| 2016 | 0.0 | 0.0 | 0.0 | 0.0 | 0.0 | 0.0 | 0.0 | 0.0 | 0.0 | 0.0 | 0.0 | 0.0 | 0.0 | 0.0 | 0.0 | 0.0 | 0.0 | ||
| 2015 | 0.0 | 0.0 | 0.0 | 0.0 | 0.0 | 0.0 | 0.0 | 0.0 | 0.0 | 0.0 | 0.0 | 0.0 | 0.0 | 0.0 | 0.0 | 0.0 | 0.0 | ||
| 2014 | 0.0 | 0.0 | 0.0 | 0.0 | 0.0 | 0.0 | 0.0 | 0.0 | 0.0 | 0.0 | 0.1 | 0.0 | 0.0 | 0.0 | 0.0 | 0.0 | 0.0 | ||
| 2013 | 0.0 | 0.0 | 0.0 | 0.0 | 0.0 | 0.0 | 0.0 | 0.0 | 0.0 | 0.0 | 0.1 | 0.0 | 0.0 | 0.0 | 0.0 | 0.0 | 0.0 | ||
| 2012 | 0.0 | 0.0 | 0.0 | 0.0 | 0.0 | 0.0 | 0.0 | 0.0 | 0.0 | 0.0 | 0.0 | 0.0 | 0.0 | 0.0 | 0.0 | 0.0 | 0.0 | ||
| 2011 | 0.0 | 0.0 | 0.0 | 0.0 | 0.0 | 0.0 | 0.0 | 0.0 | 0.0 | 0.0 | 0.0 | 0.0 | 0.0 | 0.0 | 0.0 | 0.0 | 0.0 | ||
| 2010 | 0.0 | 0.0 | 0.0 | 0.0 | 0.0 | 0.0 | 0.0 | 0.0 | 0.0 | 0.0 | 0.0 | 0.0 | 0.0 | 0.0 | 0.0 | 0.0 | 0.0 | ||
| 2009 | 0.0 | 0.0 | 0.0 | 0.0 | 0.0 | 0.0 | 0.0 | 0.0 | 0.0 | 0.0 | 0.0 | 0.0 | 0.0 | 0.0 | 0.0 | 0.0 | 0.0 | ||
| 2008 | 0.0 | 0.0 | 0.0 | 0.0 | 0.0 | 0.0 | 0.0 | 0.0 | 0.0 | 0.0 | 0.0 | 0.0 | 0.0 | 0.0 | 0.0 | 0.0 | 0.0 | ||
| 2007 | 0.0 | 0.0 | 0.0 | 0.0 | 0.0 | 0.0 | 0.0 | 0.0 | 0.0 | 0.0 | 0.0 | 0.0 | 0.0 | 0.0 | 0.0 | 0.0 | 0.0 | ||
| 2006 | 0.0 | 0.0 | 0.0 | 0.0 | 0.0 | 0.0 | 0.0 | 0.0 | 0.0 | 0.0 | 0.0 | 0.0 | 0.0 | 0.0 | 0.0 | 0.0 | 0.0 | ||
| 2005 | 0.0 | 0.0 | 0.0 | 0.0 | 0.0 | 0.0 | 0.0 | 0.0 | 0.0 | 0.0 | 0.0 | 0.0 | 0.0 | 0.0 | 0.0 | 0.0 | 0.0 | ||
| 2004 | 0.0 | 0.0 | 0.0 | 0.0 | 0.0 | 0.0 | 0.0 | 0.0 | 0.0 | 0.0 | 0.0 | 0.0 | 0.0 | 0.0 | 0.0 | 0.0 | 0.0 | ||
| 2003 | 0.0 | 0.0 | 0.0 | 0.0 | 0.0 | 0.0 | 0.0 | 0.0 | 0.0 | 0.0 | 0.0 | 0.0 | 0.0 | 0.0 | 0.0 | 0.0 | 0.0 | ||
| 2002 | 0.0 | 0.0 | 0.0 | 0.0 | 0.0 | 0.0 | 0.0 | 0.0 | 0.0 | 0.0 | 0.0 | 0.0 | 0.0 | 0.0 | 0.0 | 0.0 | 0.0 | ||
| 2001 | 0.0 | 0.0 | 0.0 | 0.0 | 0.0 | 0.0 | 0.0 | 0.0 | 0.0 | 0.0 | 0.0 | 0.0 | 0.0 | 0.0 | 0.0 | 0.0 | 0.0 | ||
| 2000 | 0.0 | 0.0 | 0.0 | 0.0 | 0.0 | 0.0 | 0.0 | 0.0 | 0.0 | 0.0 | 0.0 | 0.0 | 0.0 | 0.0 | 0.0 | 0.0 | 0.0 | ||
| 1999 | 0.0 | 0.0 | 0.0 | 0.0 | 0.0 | 0.0 | 0.0 | 0.0 | 0.0 | 0.0 | 0.0 | 0.0 | 0.0 | 0.0 | 0.0 | 0.0 | 0.0 | ||
| 1998 | 0.0 | 0.0 | 0.0 | 0.0 | 0.0 | 0.0 | 0.0 | 0.0 | 0.0 | 0.1 | 0.0 | 0.0 | 0.0 | 0.0 | 0.0 | 0.0 | 0.0 | ||
| 1997 | 0.0 | 0.0 | 0.0 | 0.0 | 0.0 | 0.0 | 0.0 | 0.1 | 0.0 | 0.1 | 0.0 | 0.0 | 0.0 | 0.0 | 0.0 | 0.0 | 0.0 | ||
| 1996 | 0.1 | 0.0 | 0.0 | 0.0 | 0.1 | 0.0 | 0.1 | 0.0 | 0.1 | 0.1 | 0.1 | 0.0 | 0.0 | 0.0 | 0.0 | 0.1 | 0.0 | ||
| 1995 | 0.1 | 0.0 | 0.0 | 0.0 | 0.0 | 0.0 | 0.0 | 0.0 | 0.0 | 0.1 | 0.1 | 0.1 | 0.0 | 0.0 | 0.0 | 0.1 | 0.0 | ||
| 1994 | 0.1 | 0.0 | 0.1 | 0.0 | 0.0 | 0.1 | 0.1 | 0.0 | 0.0 | 0.1 | 0.1 | 0.1 | 0.1 | 0.0 | 0.1 | 0.1 | 0.1 | ||
| 1993 | 0.0 | 0.0 | 0.0 | 0.0 | 0.0 | 0.0 | 0.0 | 0.1 | 0.0 | 0.0 | 0.0 | 0.1 | 0.0 | 0.0 | 0.0 | 0.0 | 0.0 | ||
| 1992 | 0.1 | 0.0 | 0.0 | 0.0 | 0.0 | 0.0 | 0.0 | 0.0 | 0.0 | 0.0 | 0.0 | 0.0 | 0.0 | 0.0 | 0.0 | 0.0 | 0.0 | ||
| 1991 | 0.0 | 0.0 | 0.0 | 0.0 | 0.0 | 0.0 | 0.1 | 0.0 | 0.0 | 0.0 | 0.0 | 0.0 | 0.0 | 0.0 | 0.0 | 0.0 | 0.0 | ||
| 1990 | 0.0 | 0.0 | 0.0 | 0.0 | 0.0 | 0.0 | 0.0 | 0.0 | 0.0 | 0.0 | 0.0 | 0.0 | 0.0 | 0.0 | 0.0 | 0.0 | 0.0 | ||
| 1989 | 0.0 | 0.0 | 0.0 | 0.0 | 0.0 | 0.0 | 0.0 | 0.0 | 0.0 | 0.0 | 0.0 | 0.0 | 0.0 | 0.0 | 0.0 | 0.0 | 0.0 | ||
| 1988 | 0.0 | 0.0 | 0.0 | 0.0 | 0.0 | 0.0 | 0.0 | 0.0 | 0.0 | 0.0 | 0.0 | 0.0 | 0.0 | 0.0 | 0.0 | 0.0 | 0.0 | ||
| 1987 | 0.0 | 0.0 | 0.0 | 0.0 | 0.0 | 0.0 | 0.0 | 0.0 | 0.0 | 0.0 | 0.0 | 0.0 | 0.0 | 0.0 | 0.0 | 0.0 | 0.0 | ||
| 1986 | 0.0 | 0.0 | 0.0 | 0.0 | 0.0 | 0.0 | 0.0 | 0.0 | 0.0 | 0.0 | 0.1 | 0.0 | 0.0 | 0.0 | 0.0 | 0.0 | 0.0 | ||
| 1985 | 0.0 | 0.0 | 0.0 | 0.0 | 0.0 | 0.0 | 0.0 | 0.1 | 0.3 | 0.0 | 0.1 | 0.0 | 0.0 | 0.0 | 0.0 | 0.1 | 0.0 | ||
| 1984 | 0.0 | 0.0 | 0.0 | 0.1 | 0.0 | 0.0 | 0.0 | 0.0 | 0.0 | 0.0 | 0.1 | 0.0 | 0.0 | 0.0 | 0.0 | 0.0 | 0.0 | ||
| 1983 | 0.0 | 0.0 | 0.0 | 0.0 | 0.0 | 0.0 | 0.2 | 0.0 | 0.5 | - | 0.0 | 0.0 | 0.0 | 0.0 | 0.0 | 0.1 | 0.0 | ||
| 1982 | - | 0.0 | - | 0.0 | 0.0 | 0.0 | - | 0.0 | - | 0.1 | - | 0.0 | 0.0 | 0.0 | 0.0 | 0.1 | 0.0 | ||
Reporting rates
Reporting rate is the proportion of all surveys in which the species was present.
Reporting rate by year
This chart shows the reporting rate of White-bellied Sea-Eagle each year between 1982 and 2017. 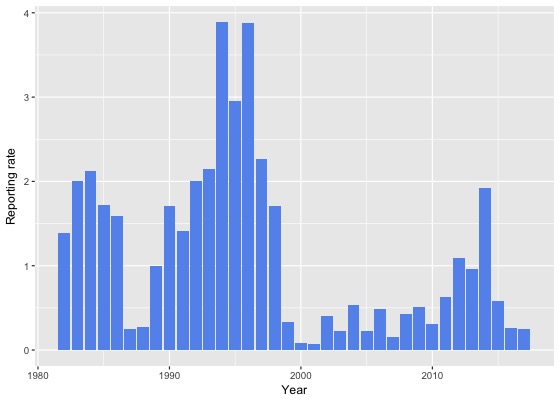
Reporting rate by month
This chart shows the reporting rate by month of White-bellied Sea-Eagle. The blue lines show the reporting rate for the twelve months to June 2017 and the bars show the average reporting rate for the period 1982 to 2017. 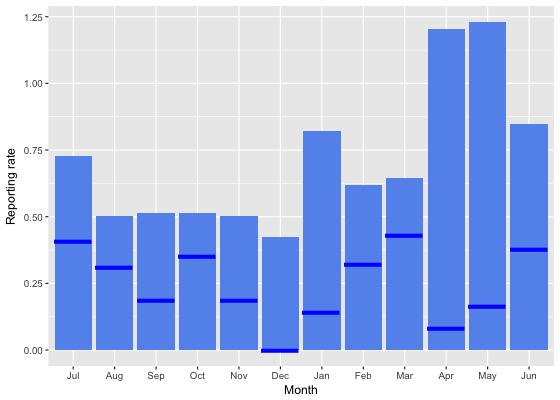
Reporting rate by season
This chart shows the seasonal reporting rate of White-bellied Sea-Eagle. The blue lines show the seasonal reporting rate for the twelve months to June 2017 and the bars show the average seasonal reporting rate for the period 1982 to 2017. 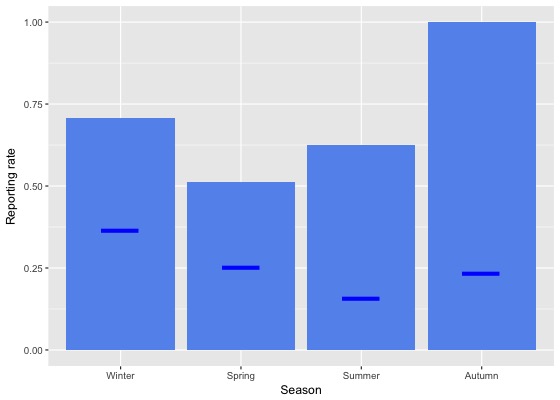
Reporting rate data
| Month | Season | ||||||||||||||||||
|---|---|---|---|---|---|---|---|---|---|---|---|---|---|---|---|---|---|---|---|
| Period | Jul | Aug | Sep | Oct | Nov | Dec | Jan | Feb | Mar | Apr | May | Jun | Winter | Spring | Summer | Autumn | All | ||
| All years | |||||||||||||||||||
| All | 0.7 | 0.5 | 0.5 | 0.5 | 0.5 | 0.4 | 0.8 | 0.6 | 0.6 | 1.2 | 1.2 | 0.8 | 0.7 | 0.5 | 0.6 | 1.0 | 0.7 | ||
| Previous years | |||||||||||||||||||
| All previous years | 0.8 | 0.5 | 0.6 | 0.5 | 0.6 | 0.5 | 1.0 | 0.7 | 0.7 | 1.4 | 1.5 | 0.9 | 0.8 | 0.5 | 0.7 | 1.1 | 0.8 | ||
| Previous 30 years | 0.8 | 0.5 | 0.6 | 0.5 | 0.6 | 0.5 | 0.9 | 0.7 | 0.6 | 1.4 | 1.4 | 0.9 | 0.8 | 0.5 | 0.7 | 1.1 | 0.8 | ||
| Previous 20 years | 0.5 | 0.4 | 0.4 | 0.5 | 0.5 | 0.3 | 0.8 | 0.6 | 0.5 | 1.1 | 1.3 | 0.6 | 0.5 | 0.4 | 0.6 | 0.9 | 0.6 | ||
| 10 year groups | |||||||||||||||||||
| [2007,2017) | 0.3 | 0.3 | 0.4 | 0.5 | 0.6 | 0.4 | 0.9 | 0.8 | 0.7 | 1.1 | 1.7 | 0.6 | 0.4 | 0.5 | 0.7 | 1.1 | 0.7 | ||
| [1997,2007) | 0.7 | 0.5 | 0.2 | 0.3 | 0.2 | 0.3 | 0.5 | 0.3 | 0.3 | 1.1 | 0.4 | 0.5 | 0.6 | 0.2 | 0.4 | 0.6 | 0.4 | ||
| [1987,1997) | 1.7 | 1.1 | 1.6 | 0.9 | 0.9 | 1.2 | 1.7 | 0.8 | 1.2 | 2.9 | 1.9 | 2.7 | 1.8 | 1.1 | 1.3 | 2.0 | 1.5 | ||
| 5 year groups | |||||||||||||||||||
| [2012,2017) | 0.4 | 0.3 | 0.5 | 0.6 | 0.8 | 0.5 | 1.0 | 0.8 | 0.8 | 1.1 | 1.8 | 0.7 | 0.5 | 0.6 | 0.8 | 1.1 | 0.8 | ||
| [2007,2012) | 0.2 | 0.2 | 0.3 | 0.3 | 0.1 | 0.0 | 0.5 | 0.8 | 0.4 | 1.0 | 1.2 | 0.4 | 0.3 | 0.3 | 0.3 | 0.8 | 0.4 | ||
| [2002,2007) | 0.7 | 0.5 | 0.1 | 0.3 | 0.1 | 0.1 | 0.5 | 0.0 | 0.3 | 1.3 | 0.3 | 0.4 | 0.5 | 0.2 | 0.2 | 0.6 | 0.4 | ||
| [1997,2002) | 0.8 | 0.6 | 0.3 | 0.3 | 0.4 | 0.6 | 0.6 | 0.6 | 0.2 | 0.9 | 0.6 | 0.7 | 0.7 | 0.3 | 0.6 | 0.5 | 0.5 | ||
| [1992,1997) | 4.6 | 1.9 | 2.3 | 1.7 | 2.0 | 2.9 | 3.1 | 1.8 | 2.7 | 4.8 | 4.3 | 5.3 | 3.8 | 2.0 | 2.7 | 3.9 | 3.1 | ||
| [1987,1992) | 0.4 | 0.6 | 1.3 | 0.5 | 0.3 | 0.5 | 1.0 | 0.4 | 0.3 | 1.8 | 0.6 | 1.3 | 0.8 | 0.7 | 0.6 | 0.9 | 0.7 | ||
| Year | |||||||||||||||||||
| 2017 | 0.4 | 0.3 | 0.2 | 0.4 | 0.2 | 0.0 | 0.1 | 0.3 | 0.4 | 0.1 | 0.2 | 0.4 | 0.4 | 0.3 | 0.2 | 0.2 | 0.2 | ||
| 2016 | 0.2 | 0.0 | 0.4 | 0.4 | 0.5 | 0.3 | 0.3 | 0.2 | 0.1 | 0.1 | 0.5 | 0.3 | 0.1 | 0.4 | 0.3 | 0.2 | 0.3 | ||
| 2015 | 0.2 | 0.2 | 0.0 | 0.7 | 1.1 | 0.7 | 0.4 | 0.6 | 0.5 | 1.1 | 1.1 | 0.3 | 0.2 | 0.6 | 0.6 | 0.9 | 0.6 | ||
| 2014 | 1.2 | 1.3 | 0.8 | 1.4 | 1.1 | 1.8 | 2.6 | 1.7 | 1.8 | 1.8 | 5.1 | 2.3 | 1.8 | 1.2 | 2.1 | 2.6 | 1.9 | ||
| 2013 | 0.9 | 0.5 | 1.9 | 0.0 | 0.3 | 0.0 | 0.9 | 1.2 | 0.8 | 1.9 | 4.2 | 1.1 | 0.8 | 0.6 | 0.6 | 1.9 | 1.0 | ||
| 2012 | 0.4 | 0.4 | 0.0 | 0.8 | 1.1 | 0.5 | 1.3 | 2.0 | 2.1 | 2.8 | 2.7 | 0.3 | 0.4 | 0.7 | 1.2 | 2.5 | 1.1 | ||
| 2011 | 0.0 | 0.0 | 0.8 | 0.4 | 0.0 | 0.0 | 0.6 | 0.9 | 0.6 | 1.9 | 1.1 | 0.6 | 0.3 | 0.4 | 0.4 | 1.2 | 0.6 | ||
| 2010 | 0.0 | 0.0 | 0.4 | 0.6 | 0.0 | 0.0 | 0.5 | 2.4 | 0.4 | 0.0 | 0.0 | 0.0 | 0.0 | 0.4 | 0.5 | 0.2 | 0.3 | ||
| 2009 | 0.0 | 1.0 | 0.0 | 0.2 | 0.0 | 0.0 | 0.0 | 0.0 | 0.9 | 1.6 | 1.5 | 1.4 | 0.9 | 0.1 | 0.0 | 1.4 | 0.5 | ||
| 2008 | 0.7 | 0.0 | 0.4 | 0.2 | 0.7 | 0.0 | 0.8 | 0.9 | 0.0 | 0.0 | 3.6 | 0.5 | 0.4 | 0.3 | 0.4 | 0.6 | 0.4 | ||
| 2007 | 0.0 | 0.0 | 0.0 | 0.0 | 0.0 | 0.0 | 0.4 | 0.0 | 0.0 | 1.3 | 0.0 | 0.0 | 0.0 | 0.0 | 0.1 | 0.5 | 0.2 | ||
| 2006 | 1.3 | 0.0 | 0.0 | 0.3 | 0.0 | 0.0 | 0.0 | 0.0 | 0.3 | 3.2 | 0.0 | 0.8 | 0.8 | 0.1 | 0.0 | 1.1 | 0.5 | ||
| 2005 | 0.7 | 0.9 | 0.0 | 0.0 | 0.0 | 0.0 | 0.0 | 0.0 | 0.4 | 1.1 | 0.0 | 0.0 | 0.4 | 0.0 | 0.0 | 0.5 | 0.2 | ||
| 2004 | 0.8 | 0.0 | 0.5 | 0.0 | 0.0 | 0.5 | 1.2 | 0.0 | 1.0 | 0.0 | 1.0 | 1.2 | 0.7 | 0.2 | 0.6 | 0.6 | 0.5 | ||
| 2003 | 0.0 | 0.7 | 0.0 | 0.5 | 0.0 | 0.0 | 0.7 | 0.0 | 0.0 | 0.9 | 0.0 | 0.0 | 0.2 | 0.2 | 0.2 | 0.4 | 0.2 | ||
| 2002 | 0.6 | 0.8 | 0.0 | 0.9 | 0.5 | 0.0 | 0.6 | 0.0 | 0.0 | 1.2 | 1.2 | 0.0 | 0.4 | 0.5 | 0.2 | 0.6 | 0.4 | ||
| 2001 | 0.0 | 0.0 | 0.0 | 0.0 | 0.0 | 0.0 | 0.0 | 0.0 | 0.3 | 0.0 | 0.0 | 0.5 | 0.2 | 0.0 | 0.0 | 0.1 | 0.1 | ||
| 2000 | 0.0 | 0.0 | 0.0 | 0.0 | 0.5 | 0.0 | 0.4 | 0.0 | 0.0 | 0.0 | 0.0 | 0.0 | 0.0 | 0.2 | 0.1 | 0.0 | 0.1 | ||
| 1999 | 0.0 | 1.0 | 0.0 | 0.0 | 0.0 | 0.6 | 0.0 | 0.0 | 0.0 | 0.5 | 1.1 | 0.5 | 0.6 | 0.0 | 0.2 | 0.5 | 0.3 | ||
| 1998 | 2.7 | 1.9 | 2.4 | 2.2 | 0.9 | 0.9 | 4.4 | 1.9 | 0.0 | 5.1 | 0.0 | 0.0 | 1.2 | 1.8 | 2.2 | 1.3 | 1.7 | ||
| 1997 | 3.4 | 1.7 | 0.0 | 0.0 | 0.9 | 3.8 | 0.0 | 5.3 | 2.5 | 3.7 | 2.2 | 4.2 | 3.2 | 0.3 | 3.3 | 3.1 | 2.3 | ||
| 1996 | 4.5 | 3.2 | 1.3 | 1.8 | 4.6 | 2.0 | 6.8 | 2.4 | 3.9 | 7.8 | 5.2 | 4.6 | 4.0 | 2.7 | 3.8 | 5.4 | 3.9 | ||
| 1995 | 5.4 | 1.6 | 1.0 | 1.2 | 1.8 | 3.4 | 0.9 | 0.0 | 3.1 | 7.3 | 5.2 | 5.3 | 3.8 | 1.3 | 1.5 | 5.4 | 2.9 | ||
| 1994 | 5.9 | 2.6 | 4.4 | 3.5 | 0.7 | 6.5 | 5.9 | 0.0 | 3.4 | 3.8 | 6.2 | 6.7 | 5.1 | 2.4 | 4.1 | 4.3 | 3.9 | ||
| 1993 | 2.0 | 1.3 | 1.6 | 1.3 | 1.5 | 2.2 | 0.0 | 6.2 | 1.2 | 3.3 | 1.3 | 5.8 | 3.1 | 1.5 | 2.4 | 1.8 | 2.2 | ||
| 1992 | 4.6 | 0.0 | 3.5 | 1.1 | 1.4 | 1.6 | 0.0 | 2.4 | 1.4 | 0.0 | 3.9 | 3.3 | 2.8 | 2.0 | 1.2 | 1.9 | 2.0 | ||
| 1991 | 0.8 | 0.0 | 3.5 | 1.0 | 0.0 | 1.4 | 5.4 | 2.0 | 0.0 | 3.4 | 0.0 | 2.0 | 0.7 | 1.4 | 2.8 | 1.1 | 1.4 | ||
| 1990 | 0.6 | 1.1 | 2.2 | 1.0 | 1.9 | 2.8 | 4.2 | 0.0 | 1.1 | 4.8 | 1.4 | 1.3 | 1.0 | 1.7 | 2.3 | 2.4 | 1.7 | ||
| 1989 | 0.5 | 1.3 | 1.7 | 0.8 | 0.5 | 0.4 | 0.5 | 0.0 | 0.0 | 3.1 | 1.3 | 1.8 | 1.2 | 1.0 | 0.3 | 1.5 | 1.0 | ||
| 1988 | 0.0 | 0.0 | 1.1 | 0.0 | 0.0 | 0.0 | 0.0 | 0.0 | 0.5 | 0.0 | 0.5 | 1.4 | 0.4 | 0.3 | 0.0 | 0.3 | 0.3 | ||
| 1987 | 0.0 | 0.0 | 0.0 | 0.4 | 0.0 | 0.0 | 0.0 | 0.8 | 0.0 | 0.8 | 0.0 | 0.5 | 0.4 | 0.1 | 0.3 | 0.3 | 0.3 | ||
| 1986 | 3.8 | 0.0 | 0.0 | 0.0 | 0.0 | 2.9 | 0.0 | 2.8 | 0.0 | 3.9 | 3.4 | 2.9 | 2.0 | 0.0 | 2.2 | 2.7 | 1.6 | ||
| 1985 | 0.0 | 3.3 | 0.0 | 1.2 | 0.0 | 0.0 | 0.0 | 5.9 | 27.3 | 0.0 | 10.0 | 0.0 | 1.1 | 0.5 | 1.2 | 10.0 | 1.7 | ||
| 1984 | 0.0 | 0.0 | 0.0 | 8.3 | 0.0 | 0.0 | 3.4 | 0.0 | 0.0 | 0.0 | 6.5 | 2.9 | 2.0 | 4.8 | 1.4 | 2.2 | 2.1 | ||
| 1983 | 0.0 | 0.0 | 0.0 | 0.0 | 0.0 | 0.0 | 16.7 | 0.0 | 50.0 | - | 0.0 | 0.0 | 0.0 | 0.0 | 3.3 | 7.1 | 2.0 | ||
| 1982 | - | 0.0 | - | 0.0 | 0.0 | 0.0 | - | 0.0 | - | 7.7 | - | 0.0 | 0.0 | 0.0 | 0.0 | 7.7 | 1.4 | ||
Breeding data
Breeding records by month
Number of breeding records by breeding code and month, 2017 and all years| Breeding code | Jul | Aug | Sep | Oct | Nov | Dec | Jan | Feb | Mar | Apr | May | Jun |
|---|---|---|---|---|---|---|---|---|---|---|---|---|
| 2017 | ||||||||||||
| Breeding (BLA code) | 0 | 0 | 0 | 0 | 0 | 0 | 0 | 0 | 0 | 0 | 0 | 0 |
| Carrying Food | 0 | 0 | 0 | 0 | 0 | 0 | 0 | 0 | 0 | 0 | 0 | 0 |
| Copulating | 0 | 0 | 0 | 0 | 0 | 0 | 0 | 0 | 0 | 0 | 0 | 0 |
| Display | 0 | 0 | 0 | 0 | 0 | 0 | 0 | 0 | 0 | 0 | 0 | 0 |
| Dependent young | 0 | 0 | 0 | 0 | 0 | 0 | 0 | 0 | 0 | 0 | 0 | 0 |
| Faecal sac | 0 | 0 | 0 | 0 | 0 | 0 | 0 | 0 | 0 | 0 | 0 | 0 |
| Inspecting hollow | 0 | 0 | 0 | 1 | 0 | 0 | 0 | 0 | 0 | 0 | 0 | 0 |
| Nest building | 0 | 0 | 0 | 0 | 0 | 0 | 0 | 0 | 0 | 0 | 0 | 0 |
| Nest with eggs | 0 | 0 | 0 | 0 | 0 | 0 | 0 | 0 | 0 | 0 | 0 | 0 |
| Nest with young | 0 | 0 | 0 | 0 | 0 | 0 | 0 | 0 | 0 | 0 | 0 | 0 |
| On/leaving nest | 0 | 0 | 0 | 0 | 0 | 0 | 0 | 0 | 0 | 0 | 0 | 0 |
| All years | ||||||||||||
| Breeding (BLA code) | 0 | 0 | 0 | 0 | 0 | 0 | 0 | 0 | 0 | 0 | 0 | 0 |
| Carrying Food | 0 | 0 | 0 | 0 | 0 | 0 | 0 | 0 | 0 | 0 | 0 | 0 |
| Copulating | 0 | 0 | 0 | 0 | 0 | 0 | 0 | 0 | 0 | 0 | 0 | 0 |
| Display | 0 | 0 | 0 | 0 | 0 | 0 | 0 | 0 | 0 | 0 | 1 | 0 |
| Dependent young | 0 | 0 | 0 | 0 | 0 | 0 | 0 | 0 | 0 | 0 | 0 | 0 |
| Faecal sac | 0 | 0 | 0 | 0 | 0 | 0 | 0 | 0 | 0 | 0 | 0 | 0 |
| Inspecting hollow | 0 | 0 | 0 | 1 | 0 | 0 | 0 | 0 | 0 | 0 | 0 | 0 |
| Nest building | 0 | 0 | 0 | 0 | 0 | 0 | 0 | 0 | 0 | 0 | 1 | 0 |
| Nest with eggs | 0 | 0 | 0 | 0 | 0 | 0 | 0 | 0 | 0 | 0 | 0 | 0 |
| Nest with young | 0 | 0 | 0 | 0 | 1 | 0 | 0 | 0 | 0 | 0 | 0 | 0 |
| On/leaving nest | 0 | 2 | 1 | 1 | 0 | 0 | 0 | 0 | 0 | 0 | 0 | 0 |
Breeding records by year
Average number of breeding records per period by breeding code| Period | Breeding (BLA code) | Carrying Food | Copulating | Display | Dependent young | Faecal sac | Inspecting hollow | Nest building | Nest with eggs | Nest with young | On/leaving nest |
|---|---|---|---|---|---|---|---|---|---|---|---|
| All years | |||||||||||
| All | 0.0 | 0.0 | 0.0 | 0.0 | 0.0 | 0.0 | 0.0 | 0.0 | 0.0 | 0.0 | 0.1 |
| Previous years | |||||||||||
| All previous years | 0.0 | 0.0 | 0.0 | 0.0 | 0.0 | 0.0 | 0.0 | 0.0 | 0.0 | 0.0 | 0.1 |
| Previous 30 years | 0.0 | 0.0 | 0.0 | 0.0 | 0.0 | 0.0 | 0.0 | 0.0 | 0.0 | 0.0 | 0.1 |
| Previous 20 years | 0.0 | 0.0 | 0.0 | 0.0 | 0.0 | 0.0 | 0.0 | 0.0 | 0.0 | 0.0 | 0.0 |
| 10 year groups | |||||||||||
| [2007,2017) | 0.0 | 0.0 | 0.0 | 0.1 | 0.0 | 0.0 | 0.0 | 0.0 | 0.0 | 0.0 | 0.0 |
| [1997,2007) | 0.0 | 0.0 | 0.0 | 0.0 | 0.0 | 0.0 | 0.0 | 0.0 | 0.0 | 0.0 | 0.0 |
| [1987,1997) | 0.0 | 0.0 | 0.0 | 0.0 | 0.0 | 0.0 | 0.0 | 0.1 | 0.0 | 0.1 | 0.4 |
| 5 year groups | |||||||||||
| [2012,2017) | 0.0 | 0.0 | 0.0 | 0.2 | 0.0 | 0.0 | 0.0 | 0.0 | 0.0 | 0.0 | 0.0 |
| [2007,2012) | 0.0 | 0.0 | 0.0 | 0.0 | 0.0 | 0.0 | 0.0 | 0.0 | 0.0 | 0.0 | 0.0 |
| [2002,2007) | 0.0 | 0.0 | 0.0 | 0.0 | 0.0 | 0.0 | 0.0 | 0.0 | 0.0 | 0.0 | 0.0 |
| [1997,2002) | 0.0 | 0.0 | 0.0 | 0.0 | 0.0 | 0.0 | 0.0 | 0.0 | 0.0 | 0.0 | 0.0 |
| [1992,1997) | 0.0 | 0.0 | 0.0 | 0.0 | 0.0 | 0.0 | 0.0 | 0.2 | 0.0 | 0.2 | 0.8 |
| [1987,1992) | 0.0 | 0.0 | 0.0 | 0.0 | 0.0 | 0.0 | 0.0 | 0.0 | 0.0 | 0.0 | 0.0 |
| Year | |||||||||||
| 2017 | 0.0 | 0.0 | 0.0 | 0.0 | 0.0 | 0.0 | 1.0 | 0.0 | 0.0 | 0.0 | 0.0 |
| 2016 | 0.0 | 0.0 | 0.0 | 0.0 | 0.0 | 0.0 | 0.0 | 0.0 | 0.0 | 0.0 | 0.0 |
| 2015 | 0.0 | 0.0 | 0.0 | 0.0 | 0.0 | 0.0 | 0.0 | 0.0 | 0.0 | 0.0 | 0.0 |
| 2014 | 0.0 | 0.0 | 0.0 | 1.0 | 0.0 | 0.0 | 0.0 | 0.0 | 0.0 | 0.0 | 0.0 |
| 2013 | 0.0 | 0.0 | 0.0 | 0.0 | 0.0 | 0.0 | 0.0 | 0.0 | 0.0 | 0.0 | 0.0 |
| 2012 | 0.0 | 0.0 | 0.0 | 0.0 | 0.0 | 0.0 | 0.0 | 0.0 | 0.0 | 0.0 | 0.0 |
| 2011 | 0.0 | 0.0 | 0.0 | 0.0 | 0.0 | 0.0 | 0.0 | 0.0 | 0.0 | 0.0 | 0.0 |
| 2010 | 0.0 | 0.0 | 0.0 | 0.0 | 0.0 | 0.0 | 0.0 | 0.0 | 0.0 | 0.0 | 0.0 |
| 2009 | 0.0 | 0.0 | 0.0 | 0.0 | 0.0 | 0.0 | 0.0 | 0.0 | 0.0 | 0.0 | 0.0 |
| 2008 | 0.0 | 0.0 | 0.0 | 0.0 | 0.0 | 0.0 | 0.0 | 0.0 | 0.0 | 0.0 | 0.0 |
| 2007 | 0.0 | 0.0 | 0.0 | 0.0 | 0.0 | 0.0 | 0.0 | 0.0 | 0.0 | 0.0 | 0.0 |
| 2006 | 0.0 | 0.0 | 0.0 | 0.0 | 0.0 | 0.0 | 0.0 | 0.0 | 0.0 | 0.0 | 0.0 |
| 2005 | 0.0 | 0.0 | 0.0 | 0.0 | 0.0 | 0.0 | 0.0 | 0.0 | 0.0 | 0.0 | 0.0 |
| 2004 | 0.0 | 0.0 | 0.0 | 0.0 | 0.0 | 0.0 | 0.0 | 0.0 | 0.0 | 0.0 | 0.0 |
| 2003 | 0.0 | 0.0 | 0.0 | 0.0 | 0.0 | 0.0 | 0.0 | 0.0 | 0.0 | 0.0 | 0.0 |
| 2002 | 0.0 | 0.0 | 0.0 | 0.0 | 0.0 | 0.0 | 0.0 | 0.0 | 0.0 | 0.0 | 0.0 |
| 2001 | 0.0 | 0.0 | 0.0 | 0.0 | 0.0 | 0.0 | 0.0 | 0.0 | 0.0 | 0.0 | 0.0 |
| 2000 | 0.0 | 0.0 | 0.0 | 0.0 | 0.0 | 0.0 | 0.0 | 0.0 | 0.0 | 0.0 | 0.0 |
| 1999 | 0.0 | 0.0 | 0.0 | 0.0 | 0.0 | 0.0 | 0.0 | 0.0 | 0.0 | 0.0 | 0.0 |
| 1998 | 0.0 | 0.0 | 0.0 | 0.0 | 0.0 | 0.0 | 0.0 | 0.0 | 0.0 | 0.0 | 0.0 |
| 1997 | 0.0 | 0.0 | 0.0 | 0.0 | 0.0 | 0.0 | 0.0 | 0.0 | 0.0 | 0.0 | 0.0 |
| 1996 | 0.0 | 0.0 | 0.0 | 0.0 | 0.0 | 0.0 | 0.0 | 0.0 | 0.0 | 1.0 | 2.0 |
| 1995 | 0.0 | 0.0 | 0.0 | 0.0 | 0.0 | 0.0 | 0.0 | 0.0 | 0.0 | 0.0 | 1.0 |
| 1994 | 0.0 | 0.0 | 0.0 | 0.0 | 0.0 | 0.0 | 0.0 | 0.0 | 0.0 | 0.0 | 1.0 |
| 1993 | 0.0 | 0.0 | 0.0 | 0.0 | 0.0 | 0.0 | 0.0 | 1.0 | 0.0 | 0.0 | 0.0 |
| 1992 | 0.0 | 0.0 | 0.0 | 0.0 | 0.0 | 0.0 | 0.0 | 0.0 | 0.0 | 0.0 | 0.0 |
| 1991 | 0.0 | 0.0 | 0.0 | 0.0 | 0.0 | 0.0 | 0.0 | 0.0 | 0.0 | 0.0 | 0.0 |
| 1990 | 0.0 | 0.0 | 0.0 | 0.0 | 0.0 | 0.0 | 0.0 | 0.0 | 0.0 | 0.0 | 0.0 |
| 1989 | 0.0 | 0.0 | 0.0 | 0.0 | 0.0 | 0.0 | 0.0 | 0.0 | 0.0 | 0.0 | 0.0 |
| 1988 | 0.0 | 0.0 | 0.0 | 0.0 | 0.0 | 0.0 | 0.0 | 0.0 | 0.0 | 0.0 | 0.0 |
| 1987 | 0.0 | 0.0 | 0.0 | 0.0 | 0.0 | 0.0 | 0.0 | 0.0 | 0.0 | 0.0 | 0.0 |
| 1986 | 0.0 | 0.0 | 0.0 | 0.0 | 0.0 | 0.0 | 0.0 | 0.0 | 0.0 | 0.0 | 0.0 |
| 1985 | 0.0 | 0.0 | 0.0 | 0.0 | 0.0 | 0.0 | 0.0 | 0.0 | 0.0 | 0.0 | 0.0 |
| 1984 | 0.0 | 0.0 | 0.0 | 0.0 | 0.0 | 0.0 | 0.0 | 0.0 | 0.0 | 0.0 | 0.0 |
| 1983 | 0.0 | 0.0 | 0.0 | 0.0 | 0.0 | 0.0 | 0.0 | 0.0 | 0.0 | 0.0 | 0.0 |
| 1982 | 0.0 | 0.0 | 0.0 | 0.0 | 0.0 | 0.0 | 0.0 | 0.0 | 0.0 | 0.0 | 0.0 |
Distribution map
Distribution - 2017
This map shows the observed distribution of the White-bellied Sea-Eagle for 2017.
The red circles are the grid cells where White-bellied Sea-Eagle have been reported.
The transparency of the red circles indicate how many surveys sheets were submitted for that grid cell; the darker the red the more reliable the data. Of the 315 grid cells with reports, 83 had only one sheet; an example is grid number A11.
The size of the circle represents the reporting rate. The maximum reporting rate for White-bellied Sea-Eagle was 100.0% (eg grid number G9) and the minimum was 0.1% (eg grid number K13). 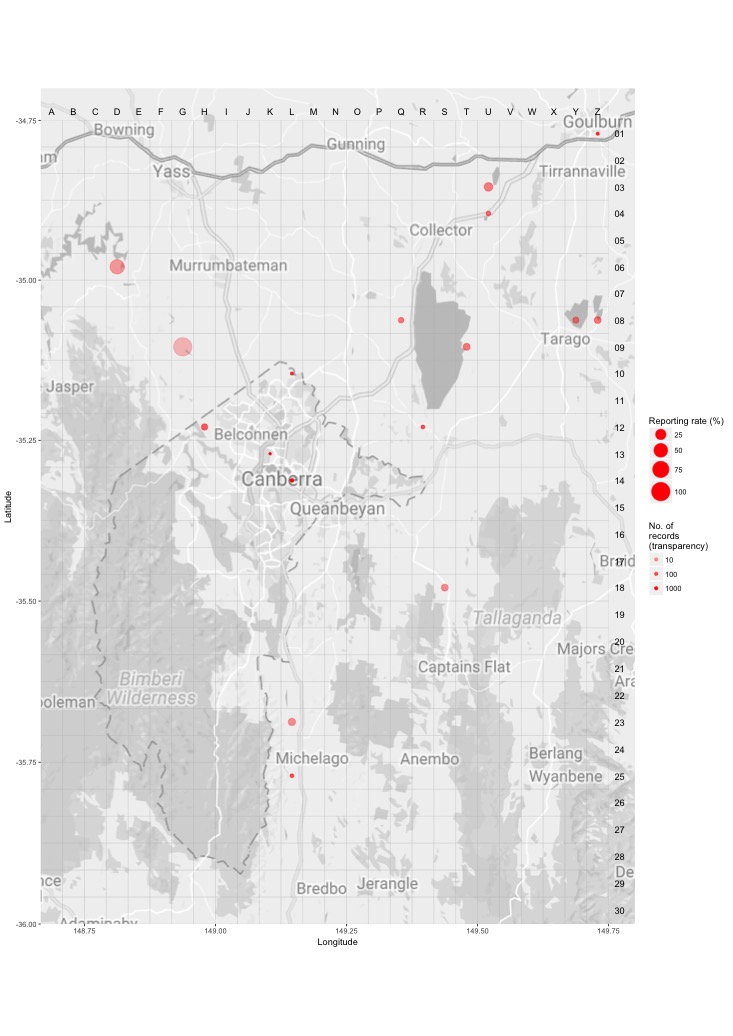
Distribution - all years
This map shows the observed distribution of the White-bellied Sea-Eagle for all years.
The red circles are the grid cells where White-bellied Sea-Eagle have been reported.
The transparency of the red circles indicate how many surveys sheets were submitted for that grid cell; the darker the red the more reliable the data. Of the 703 grid cells with reports, 55 had only one sheet; an example is grid number A12.
The size of the circle represents the reporting rate. The maximum reporting rate for White-bellied Sea-Eagle was 33.3% (eg grid number C13) and the minimum was 0.0% (eg grid number L13). 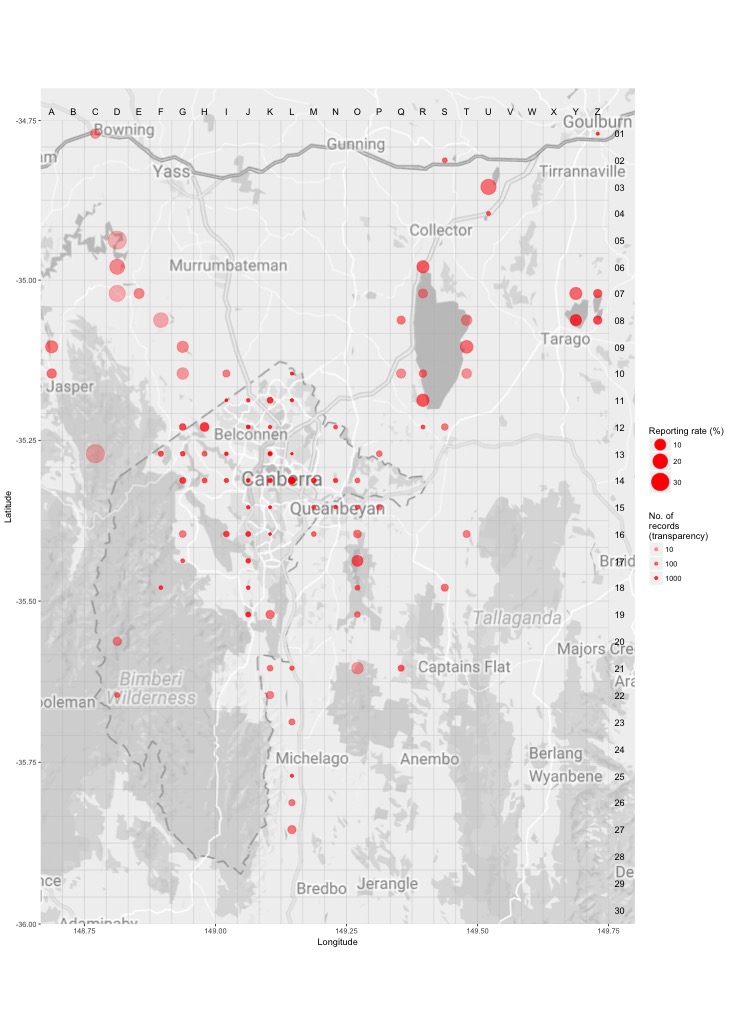
Breeding map
Breeding - 2017
This map shows the breeding distribution of the White-bellied Sea-Eagle for 2017.
The red circles are the grid cells where breeding activity for White-bellied Sea-Eagle have been reported.
The size of the circle represents the number of reports. 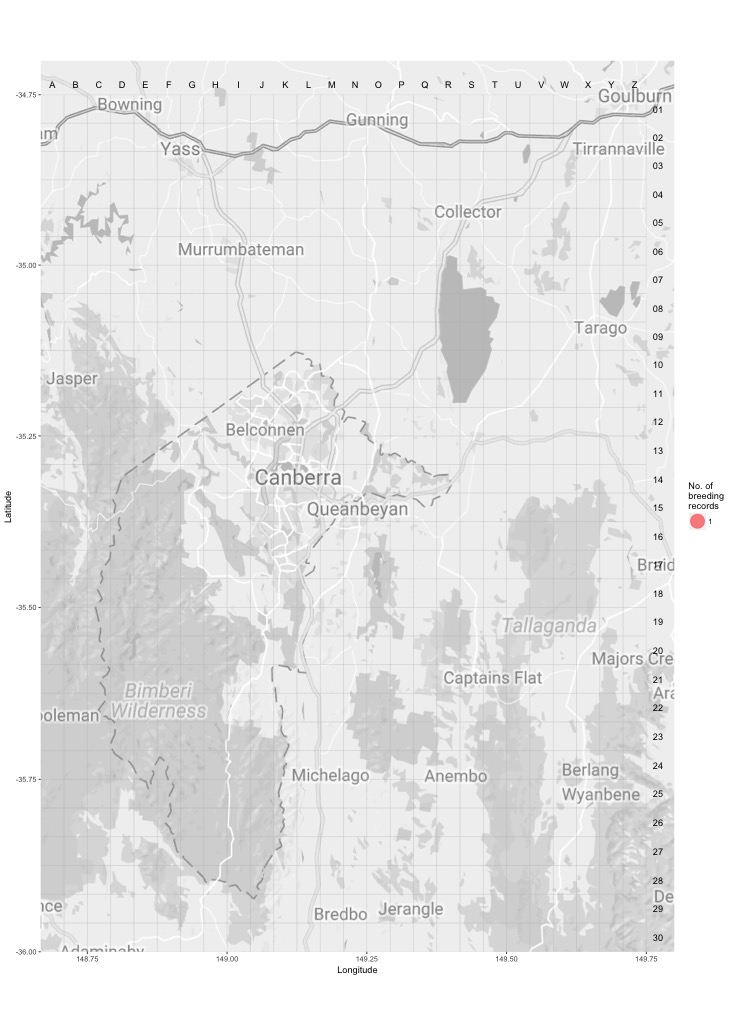
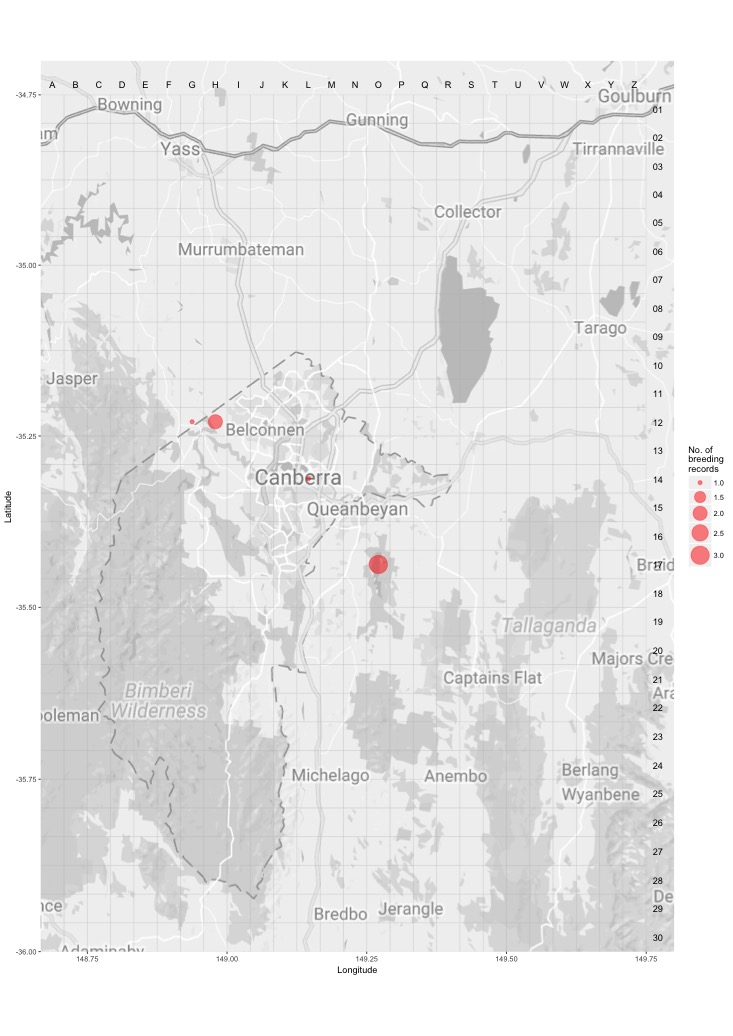
Breeding - all years
This map shows the breeding distribution of the White-bellied Sea-Eagle for all years.
The red circles are the grid cells where breeding activity for White-bellied Sea-Eagle have been reported.
The size of the circle represents the number of reports.